

The Forecasting Easy Button Redux
By Ric Kosiba, Ph.D., Vice President, Genesys’ Decisions Group
Forecasting Redux
Almost a year ago, we wrote a piece for On Target about a “Forecasting Easy Button” which could automate many of the tedious guess-and-test work required to develop sophisticated forecasts. When I wrote the piece, I was mulling over how easy it would be to build an automated forecaster, where the non-value added and tedious trial and error was eliminated by algorithms. In my dream version of the easy button, the computer did the busywork of the statistician, testing every combination of every known method against our time-series data in order to build a great forecast.
Since then we actually explored the pieces necessary to make it work. I have the luxury of some talented research and development folks in our office who like to work on things like this.
I have learned much since we wrote the last article. The first thing I learned is that in order to build an easy button, we need to follow a specific process and we have to write sophisticated code to get a computer to do many of the things we humans all do instinctively. This process is much more involved than simply iterating on forecasting methods and their parameters—we need to preprocess data, make some (automated) judgements, and we have to use the right statistics and methods to demonstrate the value of one forecast versus another.
What is interesting about this is that a manual forecasting process has some advantages; primarily that you and I are very good at pattern matching. We can see things in data in a moment that would take algorithms a fair amount of code to handle. For example, our process would have to include methods to understand outliers and detect seasonality, which we humans do pretty well just by looking at graphs. But either way, if our goal is to produce a competent automatic forecaster, we will have to write said code!
Outlier Detection
When we have clean time-series data, there are a few steps we need to take to ensure that our forecasts aren’t distorted by abnormal, non-reoccurring events that occur in most contact center data. Have you ever had your contact center “go down?” Have you ever been surprised with an anomalous wave of contacts because of some item that hit the evening news? Or a weather event? All of these are normal abnormal occurrences in our businesses, if random and infrequent. When we develop contact center plans, we may want to determine staffing levels considering random events (Frost and Sullivan had a cool white paper on the subject: Preparing for Uncertainty, the Critical Need for Contact Center Strategic Planning), but we do not want to include these funky data points in our forecasts.
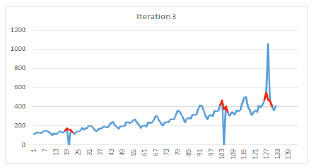
Therefore, we have to get rid of these outliers and replace them, for forecasting purposes, with made up data that looks like a normal day. How do we do this? The thought process is actually somewhat simple: if a data point is an outlier, then it is something that we would neither expect nor be able to predict. So, we build a forecast from our older data (our expectation), treating the data to be “cleaned” as hold out samples, and compare the forecasted results to the holdout data (to find points that are unexpected). Those data points that are at large variance with the forecasted data are our suspected outliers.
To do this right, we iterate: we forecast, remove, and replace the data point furthest from our expectation, and beyond a statistical threshold. Then we do it again until all data points are below the threshold. Clearly, there is some art associated with setting the threshold.
The picture below is a simplistic view of removing and replacing outliers using a forecast to determine outliers.
Detecting Seasonality and Trends
Seasonality is a repeatable pattern in time series data that a good forecasting process can exploit to improve its accuracy. The simplest way to determine whether a data stream exhibits seasonality is to stack the time series data in time-slices based on the expected seasonality and see how it looks; again, this is something that humans do intuitively. Humans can look at a data stream, find the seasonal pattern and then test whether the patterns match by printing out each stream, and holding them up to a light (the old-fashioned way!) to see if the seasonal patterns hold true.
To get a computer to do it, the algorithm must test several time-slices of varying length and mathematically do the same thing that us humans do. The algorithm has to look to see if the difference between consecutive data points and the corresponding deltas in the different slices are mostly going in the same direction. If in one year, the data changes in the same manner in matching time-slices and shrink at the same time in slice after slice, you have in essence found its seasonality.
There is a huge benefit to doing the coding, however. Once we have invested the effort to building these algorithms that mimic human pattern matching, the computer can crank through many more data sets in minutes than you or I could do in a lifetime.
Choosing a Forecasting Method and Proving its Accuracy
There are many good time series forecasting methods. Here is a quick list:
- Holt-Winters
- ARIMA
- Decomposition
- Point Estimate
- Weighted Moving Average
- Exponential Smoothing
There are a host of variants of each of these methods, and with one exception, they are all fairly simple to code—either with a formal programming language, or even within a spreadsheet.
But each method has a variety of different parameters that need to be tweaked in order for the method to mimic your data streams; this is where the “art” of forecasting comes in. Statisticians will spend a fair amount of time testing the different methods under differing parameters, and hoping to land on a method and a set of parameters that produce little error on their holdout sample. This step is something that computers and algorithms do particularly well (which was the subject of last year’s article).
A computer can look at history, apply a pre-programmed method, evaluate whether the method developed an accurate forecast on holdout data, and then cycle through another set of parameters. By looping through all relevant parameters, then measuring forecast error, the best set of parameters for that specific method can be determined. If an algorithm can cycle through all of the relevant methods and all of their parameters, then an algorithm can outperform even the best statistician.
How do we judge whether a forecast is accurate or not? There are bunches of error measures, each of which emphasize a different aspect of error. There is average absolute error, average error, and our (current) favorite, mean squared error. There are others, and you don’t have to use just one!
I did want to lend an opinion about forecasting methods. Clearly, we want to match the type of method with the type of data, meaning data that exhibits trends should use a method good for trending data. Data that exhibits seasonality should try methods that are good at forecasting seasonality.
Complex is not necessarily better. There is a fair amount of buzz of late around using ARIMA modeling for forecasting (a particularly complex method). We have gone through a fair amount of work testing algorithms against contact center time-series data, and ARIMA indeed does show up as a “best” method once in a while, but only occasionally. Just because something is complex, does not mean it is better. In the 1990s, complex neural nets were all the rage for forecasting—my experience was that an old-fashioned regression model always beat it.
I also want to make a point about my constant complaint that forecasting volume is important, but it is not the only important forecast to make. Agent shrinkage turns out to have as much of an impact on service delivery as volume, and a small shrinkage forecast error leads to large service delivery misses. It is important to forecast all important metrics including volume, handle times, sick time, agent attrition, outbound contact rates, and even customer experience metrics in order to produce a good plan.
Forecasting is an important step in workforce management and capacity planning. It used to be under the purview of statisticians or seasoned forecasters. Today we can build systems that remove the busywork of forecasting and allow machines to crank out pretty impressive results.
Ric Kosiba, PhD is a charter member of SWPP and vice president of Genesys’ Decisions Group. He can be reached at Ric.Kosiba@Genesys.com or (410) 224-9883.