Survey Results
Each quarter SWPP surveys the workforce planning community on critical workforce planning topics. Over 130 call center professionals representing a wide variety of industries participated and provided insight into this quarter’s survey on the makeup of the WFM team and the measures of success applied to the department.
Survey Participants
Forty-nine percent of the respondents in this survey work in centers with over 500 agents. The rest are representative of a wide variety of sizes from under 50 up to 500 agents. The financial, healthcare, insurance, and “other” industries drew the largest number of participants, but all other industries are also well represented.
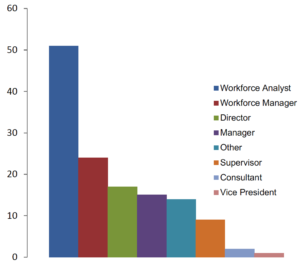
Job Title of Respondent
The most common job title of the respondents was Workforce Analyst, followed by Workforce Manager, Director, and Manager. This corresponds to the distribution of the personnel in many WFM teams with more analysts and fewer managers.
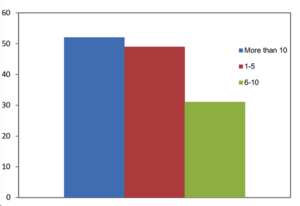
Size of the WFM Team
Respondents were asked for the size of the team working in the WFM department. The largest number of replies indicated it was more than 10 and given the significant percentage of companies represented in the survey with more than 500 agents, that is not surprising. The next highest number of replies indicated they had one to five people on the team with a somewhat smaller group having six to ten.
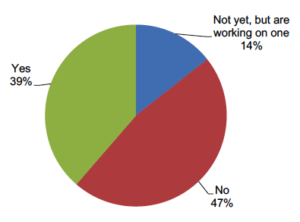
Workforce Management Scorecard
The respondents were asked if they have a WFM scorecard or report card. Nearly half (47%) indicated that they do not, while 39% replied that they do. Another 14% are working to put one in place. A scorecard can be useful in helping to ensure that management and the team are aligned on what is important and to track progress on those results.
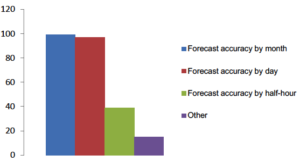
Measures of Forecasting Success
Respondents were asked to identify the measures that are used for determining forecasting success. More than one metric could be selected, and many chose both forecasting accuracy by month and by day. Accuracy by half-hour was chosen by approximately one-third of the respondents. Measuring at the smallest interval minimizes the potential for averages to cancel out significant over and under forecast periods.
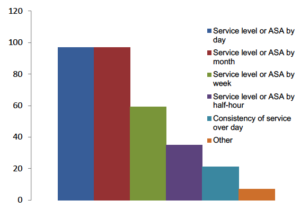
Speed of Answer Success Metrics
Respondents were asked to choose which of the metrics given for speed of answer is used for reporting in their operation. Once again, multiple answers were allowed. Service level or ASA by day and month were both chosen by the largest group of respondents. Far fewer report by week and fewer still by half-hour. Only approximately 20 respondents reported that they use consistency of service delivery over the day as a reporting metric. Consistency measures essentially eliminate the potential to hide significant swings in the results through averaging and better measure the experience of all customers regardless of when they initiate the contact.
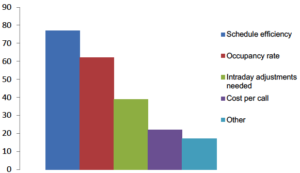
Measures of Scheduling Success
Respondents asked what metrics are used to grade scheduling success with multiple answers accepted. The largest group reported schedule efficiency (the match of scheduled staff to forecast required staff) was used. Occupancy rate was also selected by nearly half of the respondents with intraday adjustments needed and cost per call well behind. It is important to remember that occupancy is on the opposite side of a balance beam from speed of answer. To obtain a faster speed of answer, more agents are added, which lowers occupancy. If occupancy is increased to ensure everyone is busy, the service level will fall.
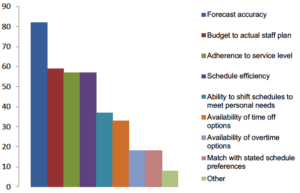
Measures of Internal Customer Satisfaction
Respondents were asked which of the listed measures of internal customer satisfaction are used and multiple answers could be chosen. Forecast accuracy was the most frequent choice. Budget to actual staff plan, adherence to service level, and schedule efficiency were essentially tied for second place.
It is clear that an accurate forecast can minimize the intraday chaos of a mismatch of staff to the workload and that is desired by both staff and management. While availability of time off and overtime options along with match to schedule preferences scored much lower than other options, these are the ones most appreciated by the frontline staff.
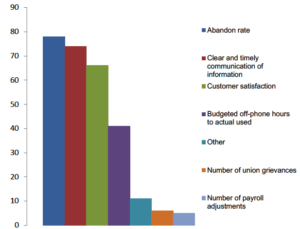
Other Measures of WFM Success
When asked what other measures are used to determine WFM success, multiple options were available once again. Abandon rate topped the list, followed closely by clear and timely communication of information. Customer satisfaction came in third, but it is not clear if this is referring to the customers of the company interacting with the center, or the customers of WFM who are the frontline staff, supervisors, and management.
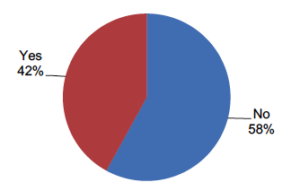
Compensation Tied to Success
Respondents were asked if their compensation reflects the success in specific WFM duties. Over half (58%) indicated that compensation is not tied to success while 42% indicated that they are linked. In cases where they are linked, it is important to ensure that the metrics used are accurately reported, somewhat controllable by the employee, and fair in their assessment of success.
Closing Comments
Based on the responses to this survey, many WFM teams have a set of metrics that are used to measure success. Some may be in conflict with one another (such as service speed and agent occupancy) making it challenging to meet all of these all the time. There may be busier periods when one is sacrificed for the other, with the opposite impact when the volume is lower. It is critical that success metrics be fair, accurately measured and reported, and relevant to the business.