The Essentials of Staff Shrinkage
By Penny Reynolds
The most laborious steps of workforce management involve forecasting workload and calculating base staff requirements. Previous articles in this series outlined the steps and calculations of forecasting. The final step of the planning process involves incorporating staff shrinkage into a base staff requirement to arrive at a final schedule requirement. This article defines shrinkage, how to calculate it, and how to apply it properly within the scheduling process.
Let’s start with an example in which a center receives 400 calls per hour with an average handle time of 180 seconds. This workload of 20 erlangs and a speed of answer goal of 80% of calls answered in 30 seconds results in a staff requirement of 23 bodies in chairs. However, scheduling 23 people to work during a certain interval will not result in 23 people actually available to take calls.
Many different things happen to take staff away from the phones. They call in sick, they go to break, they attend meetings, they log out for coaching, they go into other work states for off-phone activities, and sometimes they just wander off. The center has to account for this “shrinkage” when creating staff schedules. There will always need to be more schedules in place than the bodies in chairs requirement suggested by Erlang models and other staffing calculations such as skill-based routing simulators. The next step in the planning process is to determine how many more than 23 people will be needed on the schedule.
Defining Shrinkage
Shrinkage is defined as the percent of time for which people are paid to work that they are not available to take calls. It’s extremely important to calculate this number accurately in order to get the schedule requirement right. This is not a number that you want to pull out of the air, or refer to an “industry standard” (because there is none), or hope for an ideal. Don’t use employee benefit entitlements as your team may actually use more or less than that. You must measure what is actually happening in your center to get to the right number of schedules.
Take a look at this example with some sample shrinkage numbers. Think about how the numbers might be higher or lower in your own center.
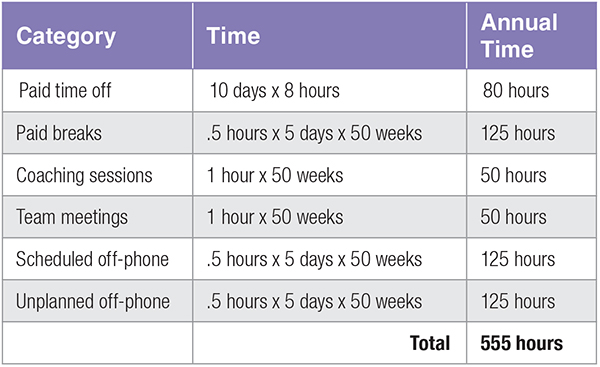
In this case, the staff have two weeks of paid time off, and then the non-productive time that happens in the other 50 weeks of the year is noted. The shrinkage across the year is 555 total hours. Assuming 40 hour per week workers, there are 2080 paid hours per year. Dividing 555 by 2080 results in a shrinkage loss of 27%.
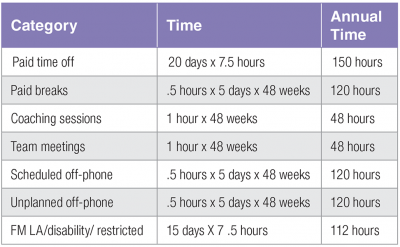
The second example provides some shrinkage numbers based on full-time equivalents of 37.5 hours per week and four weeks of paid time off per year. It also includes the staffing loss due to FMLA, a significant factor in many centers that creates a staffing loss.
In this example, there are 718 hours of shrinkage per year. Compared to the total number of paid hours per year (37.5 x 52) of 1950 hours, the shrinkage percentage is 37%. In other words, over one-third of an agent’s time is not really available for call handling.
Applying Shrinkage
Once a shrinkage factor has been calculated, it can now be used to calculate the number of scheduled staff needed. Using the earlier example of 23 staff required for 20 hours of workload and a shrinkage of 27%, the schedule requirement can be calculated. A common mistake made in applying shrinkage is to simply inflate 23 staff by 27%, but that would be incorrect. The calculation of 23 x 1.27 yields 29 staff and this will not be enough people to cover the workload with all the shrinkage. To check this, subtract 27% from 29 staff. The result is 21 staff, not 23.
The correct approach is to take the base staff requirement of 23 bodies in chairs and divide by the productive or available percentage. If shrinkage is 27%, the productive percentage is 73. The correct calculation is 23/.73 for a result of 31.5 staff. In this scenario, 32 agents need to be available to be scheduled, so that once shrinkage happens, there are 23 staff available to handle calls.
Once shrinkage has been calculated and applied, take a look at the overall impact. In this example, there were 20 hours of work to be accomplished, but because of the random arrival of calls, more staff hours were required. To meet service goals, 23 people need to be in place. But because staff are not available 100% of the time, shrinkage was calculated to reflect the time staff are not available to handle calls. In the first example, 27% shrinkage resulted in a schedule requirement of 32 people. The second example with 37% shrinkage (due to more paid time off and FMLA losses) inflated the base staff requirement of 23 people to 37 people needed for scheduling.
There is one final step when considering the number of people to be available to schedule. It is impossible to get a perfect fit of schedules across the day given the peaks and valleys of calls and the availability of staff. There will be times when more people will be available than needed because they were scheduled to meet a peak period before or after this one. When schedules are all full-time and/or very inflexible, this loss can be significant. Therefore, schedule inflexibility must be factored in to show the requisite number to provide coverage that considers schedule inflexibility. In this example, a fairly typical guideline of 10% loss due to schedule inflexibility has been added (34/.90 = 37.7 or 38 staff). Now the number of paid staff hours required has almost doubled the base workload hours from 20 to 38.
Summary
Calculating and applying shrinkage properly is an important step in the workforce management process. It’s extremely important to track each category of shrinkage and to incorporate what reflects reality in your own center. There are many industry statistics out there showing typical shrinkage numbers. Shrinkage in North America generally falls between 25 and 45% while in Europe it may range from 40-60% due to shorter workdays and more time off. However, every center is unique and some may be considerably higher due to the need of off-phone work such as research and callbacks. In the planning process it is essential that a realistic shrinkage assumption be used. If shrinkage is understated in the planning of the schedules and headcount, the center will be consistently understaffed and service goals will not be achieved.
Penny Reynolds was Co-Founder of The Call Center School and is a popular speaker and writer in the area of call center operations. Recently retired, she serves as an Educational Advisor to SWPP, continuing to provide thought leadership and training to the workforce management community. She can be reached at 615-812-8410 or pennyreynolds00@gmail.com.
The Essentials of Staff Shrinkage
By Penny Reynolds
The most laborious steps of workforce management involve forecasting workload and calculating base staff requirements. Previous articles in this series outlined the steps and calculations of forecasting. The final step of the planning process involves incorporating staff shrinkage into a base staff requirement to arrive at a final schedule requirement. This article defines shrinkage, how to calculate it, and how to apply it properly within the scheduling process.
Let’s start with an example in which a center receives 400 calls per hour with an average handle time of 180 seconds. This workload of 20 erlangs and a speed of answer goal of 80% of calls answered in 30 seconds results in a staff requirement of 23 bodies in chairs. However, scheduling 23 people to work during a certain interval will not result in 23 people actually available to take calls.
Many different things happen to take staff away from the phones. They call in sick, they go to break, they attend meetings, they log out for coaching, they go into other work states for off-phone activities, and sometimes they just wander off. The center has to account for this “shrinkage” when creating staff schedules. There will always need to be more schedules in place than the bodies in chairs requirement suggested by Erlang models and other staffing calculations such as skill-based routing simulators. The next step in the planning process is to determine how many more than 23 people will be needed on the schedule.
Defining Shrinkage
Shrinkage is defined as the percent of time for which people are paid to work that they are not available to take calls. It’s extremely important to calculate this number accurately in order to get the schedule requirement right. This is not a number that you want to pull out of the air, or refer to an “industry standard” (because there is none), or hope for an ideal. Don’t use employee benefit entitlements as your team may actually use more or less than that. You must measure what is actually happening in your center to get to the right number of schedules.
Take a look at this example with some sample shrinkage numbers. Think about how the numbers might be higher or lower in your own center.
In this case, the staff have two weeks of paid time off, and then the non-productive time that happens in the other 50 weeks of the year is noted. The shrinkage across the year is 555 total hours. Assuming 40 hour per week workers, there are 2080 paid hours per year. Dividing 555 by 2080 results in a shrinkage loss of 27%.
The second example provides some shrinkage numbers based on full-time equivalents of 37.5 hours per week and four weeks of paid time off per year. It also includes the staffing loss due to FMLA, a significant factor in many centers that creates a staffing loss.
In this example, there are 718 hours of shrinkage per year. Compared to the total number of paid hours per year (37.5 x 52) of 1950 hours, the shrinkage percentage is 37%. In other words, over one-third of an agent’s time is not really available for call handling.
Applying Shrinkage
Once a shrinkage factor has been calculated, it can now be used to calculate the number of scheduled staff needed. Using the earlier example of 23 staff required for 20 hours of workload and a shrinkage of 27%, the schedule requirement can be calculated. A common mistake made in applying shrinkage is to simply inflate 23 staff by 27%, but that would be incorrect. The calculation of 23 x 1.27 yields 29 staff and this will not be enough people to cover the workload with all the shrinkage. To check this, subtract 27% from 29 staff. The result is 21 staff, not 23.
The correct approach is to take the base staff requirement of 23 bodies in chairs and divide by the productive or available percentage. If shrinkage is 27%, the productive percentage is 73. The correct calculation is 23/.73 for a result of 31.5 staff. In this scenario, 32 agents need to be available to be scheduled, so that once shrinkage happens, there are 23 staff available to handle calls.
Once shrinkage has been calculated and applied, take a look at the overall impact. In this example, there were 20 hours of work to be accomplished, but because of the random arrival of calls, more staff hours were required. To meet service goals, 23 people need to be in place. But because staff are not available 100% of the time, shrinkage was calculated to reflect the time staff are not available to handle calls. In the first example, 27% shrinkage resulted in a schedule requirement of 32 people. The second example with 37% shrinkage (due to more paid time off and FMLA losses) inflated the base staff requirement of 23 people to 37 people needed for scheduling.
There is one final step when considering the number of people to be available to schedule. It is impossible to get a perfect fit of schedules across the day given the peaks and valleys of calls and the availability of staff. There will be times when more people will be available than needed because they were scheduled to meet a peak period before or after this one. When schedules are all full-time and/or very inflexible, this loss can be significant. Therefore, schedule inflexibility must be factored in to show the requisite number to provide coverage that considers schedule inflexibility. In this example, a fairly typical guideline of 10% loss due to schedule inflexibility has been added (34/.90 = 37.7 or 38 staff). Now the number of paid staff hours required has almost doubled the base workload hours from 20 to 38.
Summary
Calculating and applying shrinkage properly is an important step in the workforce management process. It’s extremely important to track each category of shrinkage and to incorporate what reflects reality in your own center. There are many industry statistics out there showing typical shrinkage numbers. Shrinkage in North America generally falls between 25 and 45% while in Europe it may range from 40-60% due to shorter workdays and more time off. However, every center is unique and some may be considerably higher due to the need of off-phone work such as research and callbacks. In the planning process it is essential that a realistic shrinkage assumption be used. If shrinkage is understated in the planning of the schedules and headcount, the center will be consistently understaffed and service goals will not be achieved.
Penny Reynolds was Co-Founder of The Call Center School and is a popular speaker and writer in the area of call center operations. Recently retired, she serves as an Educational Advisor to SWPP, continuing to provide thought leadership and training to the workforce management community. She can be reached at 615-812-8410 or pennyreynolds00@gmail.com.