WFM Summer Survey Results
Each quarter SWPP surveys the workforce planning community on critical workforce planning topics. Over 175 call center professionals representing a wide variety of industries participated and provided insight into this quarter’s survey goals for speed of answer.
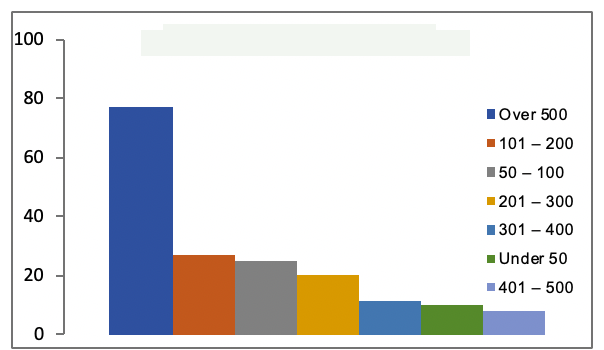
Survey Participants
Forty-three percent of the respondents to this survey work in centers with over 500 agents. The rest are representative of a wide variety of sizes from under 50 up to 500 agents. The financial, insurance, and “other” industries drew the largest number of participants, but all other industries are also well represented.
Who Defines Speed of Answer Goal
Respondents were asked who is responsible for setting the goal for speed of answer and multiple choices were accepted. The Contact Center Vice President or Director was the most frequent choice with WFM Manager second. Others were less frequently selected and may be additional players when one of the others is the primary responsible party.
Definition of Speed of Answer Goal
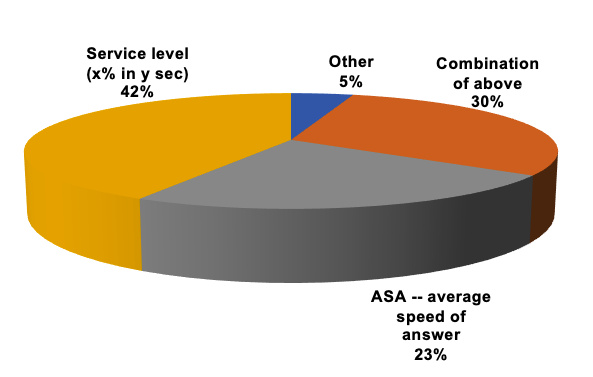
Respondents were asked what definition is used for the speed of answer goal. Over forty percent (42%) indicated that they use Service Level (SL) as their goal definition (x % of contacts answered within y seconds). Another 23% chose ASA or Average Speed of Answer for their definition. However, almost one-third (30%) use a combination of these goals and that can be problematic. The math behind these two calculations does not produce consistently matching results. For example, if the call volume in a period is low, one may be achieved while the other is not, and if the volume is very high in the same team, the opposite effect is seen. While it is possible to choose SL for one team or contact type and ASA for another, applying both to the same work can result in frustration and misleading reporting.
Goal Percentage for Service Level
The respondents were asked to provide the percentage of contacts to be answered within the defined speed of answer or the X in the formula. Just over 40% indicated that their goal is 76% to 80%. The balance of the responses is scattered between under 70% and over 90%. There is no one goal that is “industry standard” or appropriate for all situations. An emergency response center might have a very different expectation than a leisure travel operation for example. It is important to understand the customer expectations, the costs, and the agent satisfaction implications of the goal that is chosen.

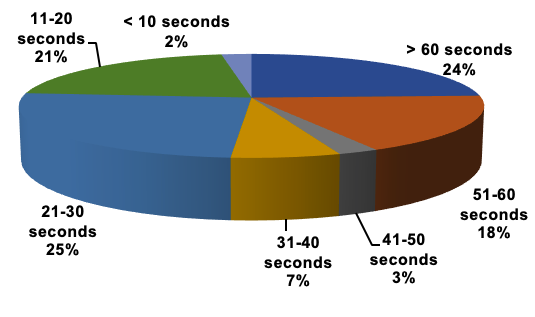
Number of Seconds in SL Goal
Respondents were then asked to provide the second part of the SL goal definition or the Y number of seconds before answer. Once again, the answers are widely dispersed from less than 10 seconds to more than 60 seconds. Almost half have goals of 30 seconds or less, with a surprising 24% reporting their goal at more than 60 seconds. Remember the accepted percentage that do not meet the goal may wait almost any length of time from one second longer to many minutes. Once again, the length of the wait has significant implications on customer satisfaction, cost, and agent occupancy. Finding the right balance for each work type is challenging but worth the effort.
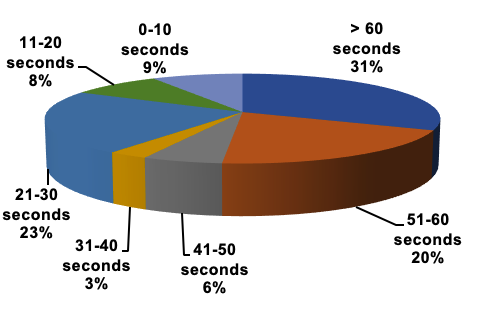
ASA Goal
Respondents were asked to provide the number of seconds in the ASA goal used in their operations. Half (51%) reported a goal of 50 seconds or more while 9% reported a goal of 10 seconds or less. Once again, the variation in these goals is likely a function of the needs of the customers and the organization and there is no standard expectation. However, it is important to understand that the average in this calculation is just that. Roughly half of the callers will wait less than the average and half longer. Some will be answered immediately during slow periods and others may wait several minutes during busier periods, but all will be averaged together over a period in the reports. Therefore, it is important to report on a short timeframe such as half-hourly to see the actual service that is being provided as averaging over a day or week can hide significant variations.
Abandoned Call Goal
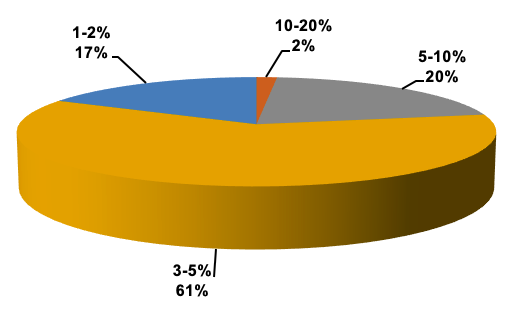
Respondents asked if they have a goal for abandoned calls and 65% indicated that they do. The most common goal is 3-5%. While no one wants to see customers abandoning from the queue because the wait is too long, setting a goal is challenging. There is no reliable mathematical formula for predicting abandon rates as this is a function of human behavior and can vary widely for no obvious reason.
Abandoned Call Goal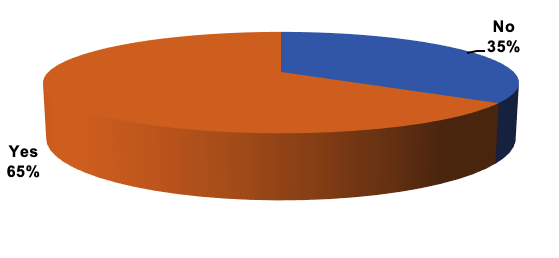
Abandoned Call Percentage Goal
How Goals Were Set
Respondents were asked how they determined what their goals should be, and the answers were free form text. The most common answers are below:
- Studied correlation between answer speed and abandon calls to inform the goal, based on our customer base. We have also considered some industry benchmarking in setting the goal.
- Depending on the line of business. For Insurance, we have roll over logic that sends calls from the contact center to the branch network. We don’t want calls to roll to the branches so we put our goal at that threshold which is 60 seconds. For roadside service we use 80/30. 30 has been relatively arbitrary to date, but we are doing more analysis around member patience.
- Aligned with average delay to abandon…made ASA goal shorter.
- Review of impact on customer tolerance, agent occupancy, and revenue vs cost.
- Investor requirements.
- At 80% in 30 seconds, our abandonment percentage falls at or below 4% and keeps our max delay reasonable. We set it in 2001 and confirm our reasoning every few years.
- A histogram analysis of abandonment rates, along with service level.
- It was provided by our client.
- Industry standards.
- Site leadership and WFM collaboration – reassessed as environment/customer expectations/tolerance changes
- We reviewed the abandon rate tendency of our callers, as well as the sensitivity of our ASA results compared to various FTE levels.
- That is specified in the client contract. SL should be more than 90% and abandon as low as possible.
- Based on abandon rate targets used in other healthcare industry organizations. Also, correlated the abandon rate to a service level target of 80% in 20 seconds.
- Feedback/survey results from clients in conjunction with executive leadership and finance.
- Line of business decides – depending on that, we have different goals. One has 30 seconds and another has 20 seconds
Length of Time Goal Has Been in Place
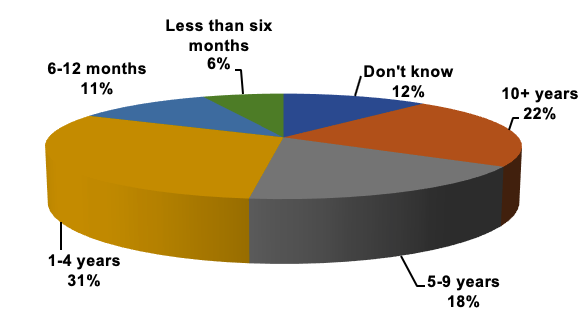
When asked how long the current goals have been in place, the answers are widely dispersed. One to 4 years was reported by 31% of the respondents with 18% reporting 5 to 9 years. Ten years or more was reported by 22%. If the goals have not changed in several years, it may be time to review the business needs and determine if the goal is still the best balance of customer needs, organization needs, and costs.
Measures of Success
Respondents were asked how they measure their success in meeting their speed of answer goals. Forty percent measure the average across a month and another 6% average over the week. This length of period of averaging can hide a significant variation by time of day or day of week. Only 12% reported that they measure the percent of periods within a day that the goal was met.
How Speed of Answer Goal Success Measured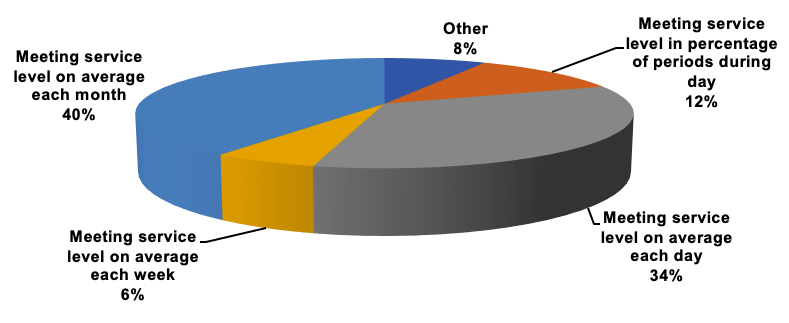
When asked to report on the levels of success by half-hour, 30% reported a result between 80 and 90%. Another 24% indicated that they achieve the goal in 70-80% of the half-hours. Digging into the half-hourly achievement can reveal specific times of day or even days of the week that are consistently well below or well above the goal. This can lead to specific action to identify reasons and corrective steps while only looking at averages over time makes it difficult to know what to do to improve the results.
Half-Hour Speed Goals Percentage Met

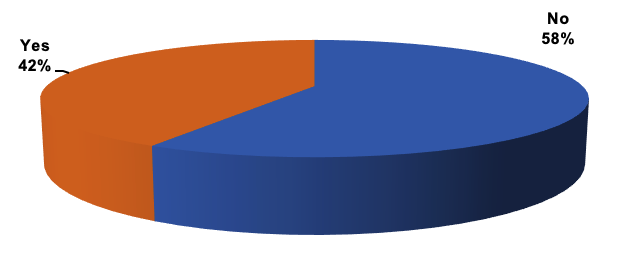
Asked whether they measure customer satisfaction with the speed of answer goal, the answers are fairly evenly split between Yes and No.
Customer Satisfaction Measure
When asked if there are any plans to change the goals, 81% indicated that they do not plan any change. Fifteen percent indicated they plan to raise their goal while a small percentage indicated that they planned to lower theirs.
Plans for Service Goal

Closing Comments
Based on the responses to this survey, the speed of answer goals vary widely, as they should. Each operation or even each work type within a single center may have a different set of dynamics in play. One might be a sales operation and another technical support. Even a hospital emergency room and the medical records department would have very different needs. Analysis of the balance between the needs of the customers, the organization, and the costs is necessary to find the most effective goals. Then measuring the success of achievement of those goals should be focused on where there might be opportunities for improvement. This is best identified by looking at the details of achievement in every interval rather than averages over a long period of time.